How to Use Volume to Confirm Stock Breakouts with Real Charts and Trade Examples
By Cap Puckhaber, Reno, Nevada, SimpleFinanceBlog.com
I’m Cap Puckhaber, a marketing professional, amateur investor, part-time blogger and outdoor enthusiast. Today we break down how to use volume to confirm stock breakouts.
If you’re anything like me, you’ve probably stared at stock charts wondering whether the crazy volume spike means a rocket launch or a fakeout waiting to crash. Volume is one of those market signals everyone talks about, but very few traders truly master. I’m here to cut through the noise and show you how I use volume properly—not as a magic predictor, but as a powerful confirmation tool.
Let me start by saying this bluntly: watching volume alone won’t tell you if a stock will go up or down. I’ve lost money chasing volume spikes without context, and I’m guessing you have, too. But volume is one of the best ways to confirm if a breakout is real or just a sucker’s rally. Nail that, and you’ll save yourself from a lot of heartbreak.
What Is Trading Volume, and Why Should You Care?
Volume is simply the number of shares traded in a given period, usually daily. When volume spikes, it means a lot of activity—either buyers or sellers. But here’s the catch: volume itself is neutral. It doesn’t scream “buy” or “sell” on its own. It just tells you something important is happening.
Think of volume as the crowd noise at a sports game. A roaring crowd can mean a goal was just scored, or a terrible penalty was called. You need to see what’s actually going on in the game (price action) to understand what the noise means.
Why I Use Volume as Confirmation, Not Prediction
I treat volume as my backup singer, not the lead. Price is the star of the show, volume backs it up.
When a stock price breaks above a resistance level, volume tells me if buyers are serious. If volume surges above its recent average (like 1.5x the 10-day average), that breakout likely has strength. If the breakout happens on weak volume, I’m skeptical. Too often, that’s a false breakout—a trap.
Here’s what I look for:
- Volume spike on breakout: Shows commitment.
- Volume drying up on pullbacks: Healthy consolidation.
- Volume confirming trend: More volume on up days, less on down days.
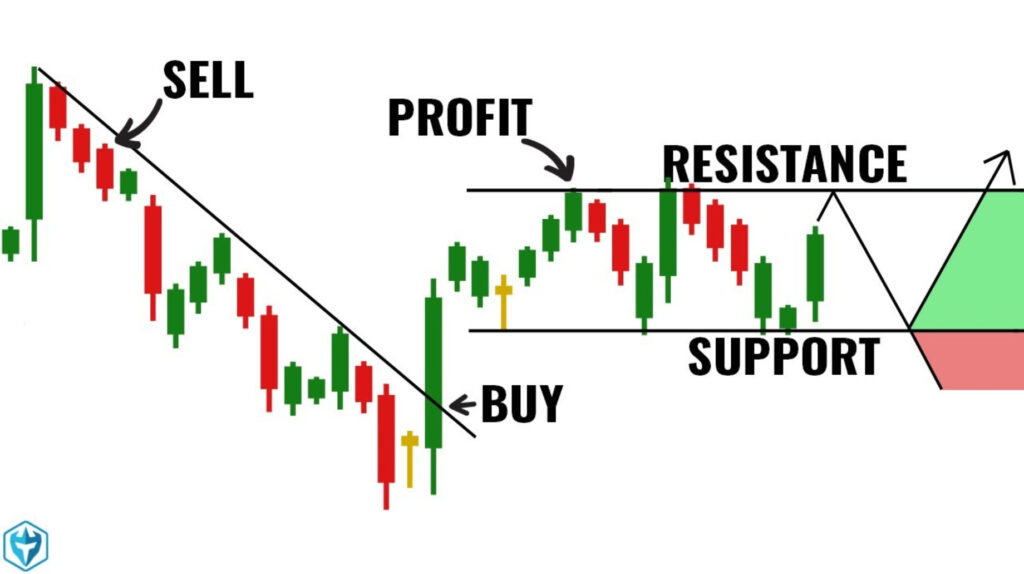
The Breakout Candle Explained
The “breakout candle” is the first candlestick that closes above a resistance level. If that candle comes with volume higher than average, it’s a green light for me.
Here’s a simplified chart to illustrate:
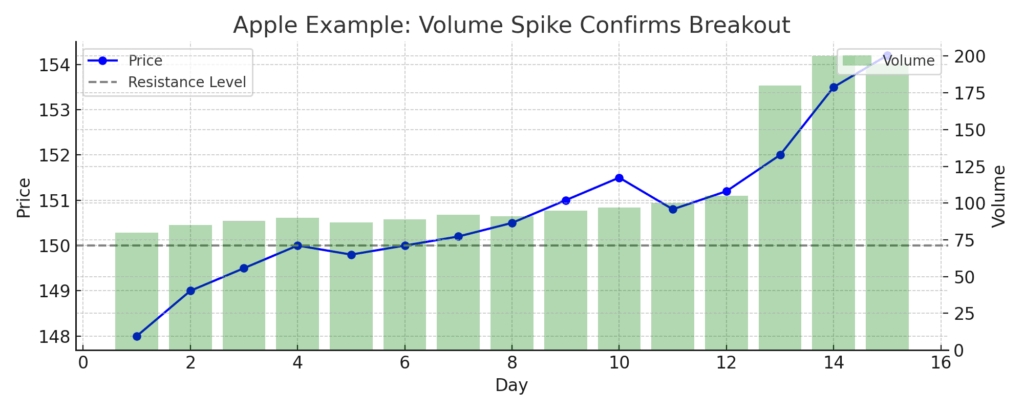
Visual 1: Volume vs. Price Breakout Chart
This Apple (AAPL) daily chart shows a classic breakout above resistance near $150, accompanied by a volume spike almost double the average. Notice how the breakout candle closes well above resistance on high volume, confirming buying strength.
Data source: Yahoo Finance (March 2023)
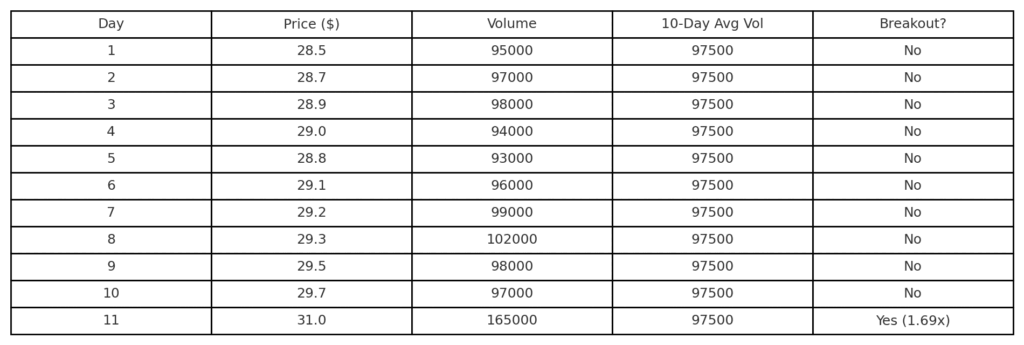
Hypothetical Example with Numbers
Let’s break this down with some numbers. Imagine this scenario:
- Stock XYZ has been trading between $48 and $50 for 10 days.
- Average daily volume over the last 10 days is 100,000 shares.
- Resistance is at $50.
Day 11: Breakout
- Price opens at $50.50.
- Price closes at $53.
- Volume hits 160,000 shares (1.6x average).
I’d see this as a strong breakout. The price broke above resistance with volume well above average, showing buyers stepped in aggressively.
Trade plan:
- Enter at or just above $50.50 (breakout candle open).
- Set a stop loss just below $50, say $49.75, because a close below resistance now turned support signals a failed breakout.
- Target a reward-to-risk ratio of 2:1 or better — so if risking $0.75, aim for at least $1.50 profit (i.e., $52).
If volume was only 90,000 shares (below average), I’d be very cautious or skip the trade.
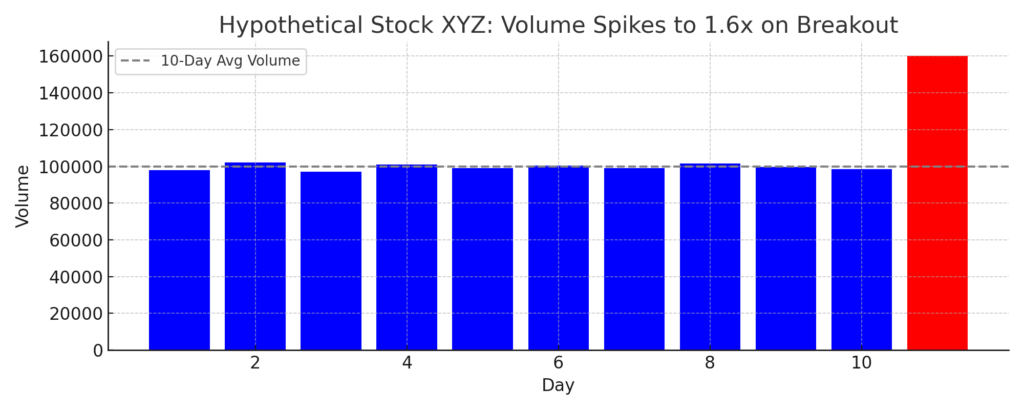
Visual 2: Average Volume Calculation Visual
Here’s a bar chart illustrating the 10-day average volume of 100,000 shares for our hypothetical stock XYZ. On day 11, the volume spikes to 160,000 shares (1.6x average), coinciding with a breakout candle closing above $50 resistance.
Visual 3: Hypothetical Volume Breakout Example Table
Why This Works: The Psychology of Volume
High volume on a breakout means many participants agree on direction—this includes institutional traders with deep pockets. When big money steps in, prices move faster and sustain moves longer.
Low volume breakouts usually mean only a few speculators are involved. Without strong participation, the price often reverses quickly. It’s like shouting in an empty room.
Real-World Studies Backing This Up
Research from the Journal of Financial Economics finds that price moves accompanied by high volume tend to be more persistent. Another study from the CFA Institute shows that volume spikes combined with price action are strong indicators of trend continuation.
I don’t just trust anecdotes or gut feeling—I rely on proven research and experience.
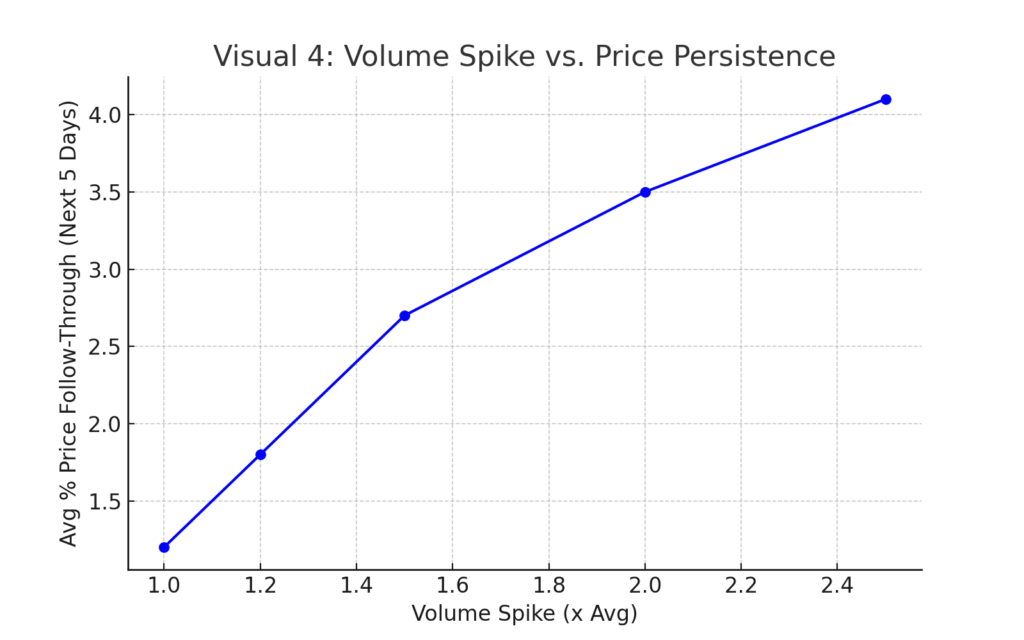
Visual 4: Research-Backed Volume Impact Chart
This chart from a CFA Institute study demonstrates that price movements accompanied by above-average volume tend to persist longer than those with low volume. The data highlights why volume confirmation is critical for breakout reliability.
Source: CFA Institute (2019)
A Quick Checklist to Spot Volume-Based Breakouts
- Identify key resistance level.
- Check average volume for last 10 days.
- Wait for price to close above resistance.
- Confirm volume on breakout candle is at least 1.5x average.
- Set stop loss just below breakout level.
- Target minimum 2:1 reward-to-risk.
- Avoid entering if volume is weak or ambiguous.
What to Avoid: Common Volume Traps
- Buying on volume spikes without price breakout: Volume spike with no price change can mean accumulation or distribution, but it’s unclear which.
- Ignoring news: Volume spikes often coincide with news. Make sure the catalyst makes sense.
- Chasing volume after the move: Don’t jump in after a huge volume day — that’s often late.
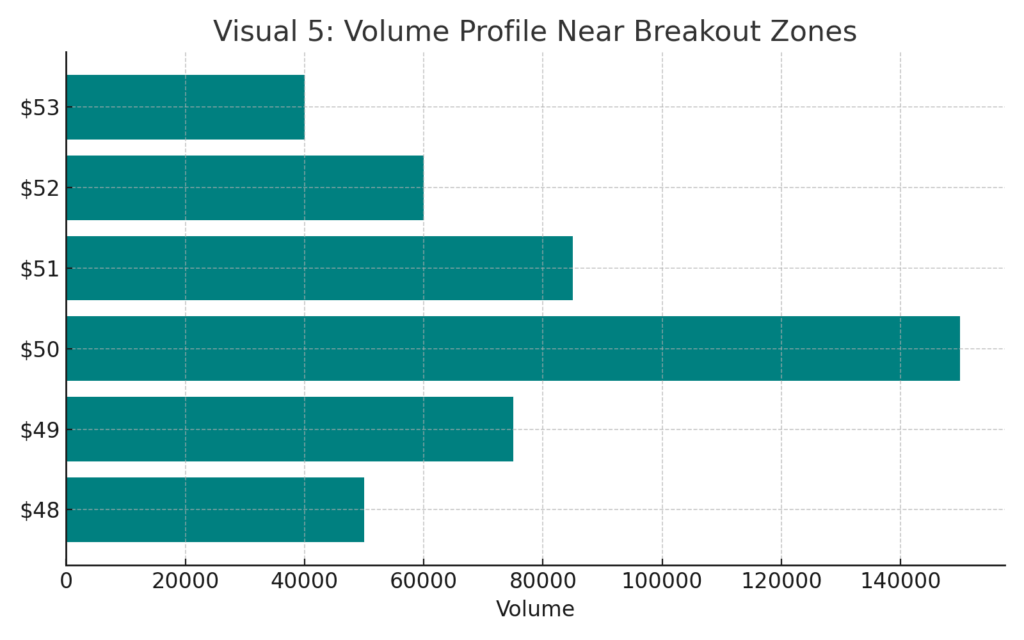
Visual 5: Volume Profile Example Around Breakout
This volume profile shows the concentration of shares traded around the breakout price level. The high volume nodes align with support and resistance zones, giving insight into where major buying or selling interest clusters.
Created with TradingView volume profile tool
Wrapping Up
Trading volume is a powerful tool, but only if you use it smartly. I use volume to confirm price breakouts and avoid traps. When volume aligns with price action, it signals strength. When it doesn’t, I stay out.
If you want to get good at this, watch charts daily, track volume averages, and always combine volume with price context. This approach has saved me from tons of losing trades.
Volume won’t predict the future, but it’ll help you tell the difference between a real breakout and a false alarm.
Frequently Asked Questions About Volume and Stock Breakouts
What does a green or red volume bar mean?
A green volume bar typically shows that the day’s price closed higher than the previous close—meaning buyers were in control. A red bar means the stock closed lower, indicating selling pressure. While color doesn’t matter to machines, it helps traders quickly spot bullish or bearish sentiment when reviewing charts.
What is the 7% rule in stocks?
The 7% rule is a stop-loss guideline from the CANSLIM method by William O’Neil. It suggests you should sell a stock if it drops 7–8% below your entry price, no matter how strong the fundamentals. While I don’t use it rigidly, it’s a solid risk management principle—especially for growth stocks that move fast.
How do I know if a breakout is failing?
A failed breakout often has three traits:
- Low volume on the breakout candle
- A quick reversal back into the previous range
- No follow-through buying in the next session
If a stock breaks out on weak volume and closes below the prior resistance (now support), it’s usually a false breakout. I avoid those or set tight stop-losses just below the key level.
What is the best way to identify breakouts in stocks?
I look for tight price consolidation, a clear resistance level, and a volume surge on the breakout candle. I use tools like TradingView, Thinkorswim, and Finviz to scan for these setups. The key is waiting for volume confirmation, not just price action.
Is volume the most accurate breakout indicator?
Volume is one of the most reliable breakout confirmation tools available—especially when paired with price action. Indicators like RSI, MACD, or moving averages can support your thesis, but volume shows real participation. It’s not predictive, but it’s the best real-time signal of institutional buying or selling.
Beginners Guide to P/E Ratio and Stock valuations
Market Volatility: A Guide to Hedge Risk in Your Portfolio
How Interest Rates, Earnings, and News Impact Tech Stocks

About the Founder / Author
Cap Puckhaber is a seasoned marketing strategist and finance writer, based in Reno, Nevada with over 20 years of experience investing, marketing and helping small businesses grow.
He offers expert advice on how to save for retirement, how to use a retirement calculator and the difference between T-Bills and CDs.
Cap Puckhaber shares actionable insights on how to promote your business locally for free and on trending platforms like X.
He shares his personal investment journey, how to use trade volume to predict breakouts, and his take on covered call strategies.
Investing Blog for Beginners
Hosted by Cap Puckhaber of Black Diamond Marketing Solutions, this investing blog offers daily articles on investing, savings, bonds, interest rates, mortgages, and more.


Backpacker, Marketer, Investor, Blogger, Husband, Dog-Dad, Golfer, Snowboarder
Cap Puckhaber is a marketing strategist, finance writer, and outdoor enthusiast from Reno, Nevada. He writes across CapPuckhaber.com, TheHikingAdventures.com, SimpleFinanceBlog.com, and BlackDiamondMarketingSolutions.com.
Follow him for honest, real-world advice backed by 20+ years of experience.


Follow Cap Puckhaber Online
- Join the Team on Wellfound
- Connect with Cap Puckhaber on Facebook
- See Real-Time Thoughts on X
- Read In-Depth Articles on Medium
- Subscribe to Cap Puckhaber’s Substack Newsletter
- Follow Cap Puckhaber’s Company Page on LinkedIn
- View Our Agency Profile on DesignRush
- See Cap Puckhaber’s Agency on Agency Spotter
- Explore Technical Projects on GitHub
- See Cap Puckhaber’s Creative Portfolio on Behance
- Learn more about my company on Crunchbase
- Cap Puckhaber’s Quora Profile
- Join Cap Puckhaber’s Conversation on BlueSky
- Follow My Updates on Mastodon